

Q3 2023 Earnings Update #2
Q3 2023 Earnings Update #2
AAPL, TXRH, MPWR, EXPO
Apple (Dashboard)
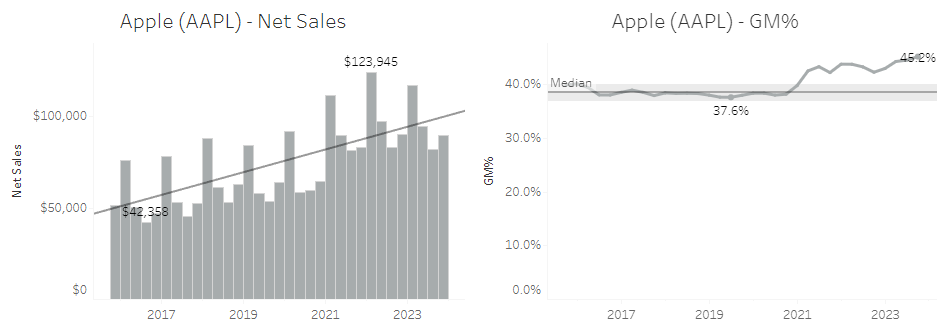
Apple AAPL 0.00%↑ sales were flat compared to last year but overall continued an upward trend. It is a very interesting sales chart, though, because that upward trend is mainly driven by one step up in revenue during 2021. The five years before that are up slightly, maybe 1 or 2%, and then the couple years since then are basically flat, or again, slightly up.
Gross margin was very strong at 45% as Services continue to grow as a larger portion of the overall business.
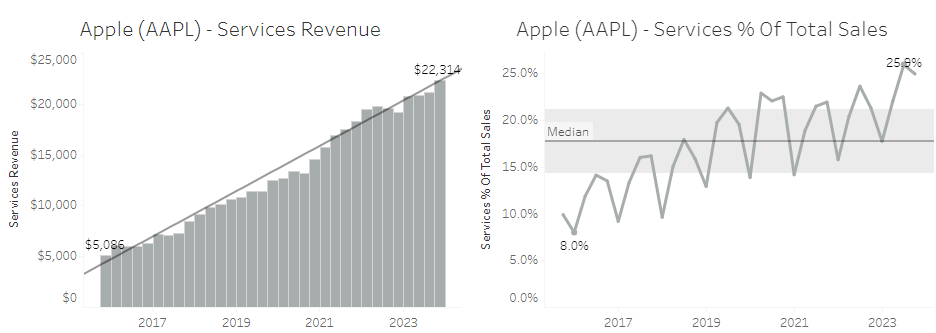
The Services segment keeps delivering steady growth and is now over a quarter of total sales. Services gross margin is around 70-71%.
“Our installed base of over 2 billion active devices continues to grow at a nice pace and establishes a solid foundation for the future expansion of the ecosystem. And we continue to see increased customer engagement with our Services. Both transacting accounts and paid accounts grew double digits year-over-year, each reaching a new all-time high. Also, our paid subscriptions showed strong growth.
We have well over 1 billion paid subscriptions across the services on our platform, nearly double the number we had only 3 years ago. And finally, we continue to improve the breadth and quality of our current services from exciting new content on Apple TV+ and Apple Arcade to additional storage tiers on iCloud. We believe our customers will love these new offerings.” - CFO Luca on Q4 FY23 call
With Services creating a better revenue and margin mix, along with another $77.55B of share repurchases in FY23, and a lower tax rate, Apple is able to grow earnings per share nicely.

Here is my updated DCF spreadsheet with the latest 10-K data:
The result is not much different from my June post. The cost of capital is higher since then due to the higher risk-free rate. I boosted margins a few more points to reflect higher Services mix. Feel free to download the spreadsheet and put your own assumptions in. I am curious what other investors think.
Texas Roadhouse (Dashboard)
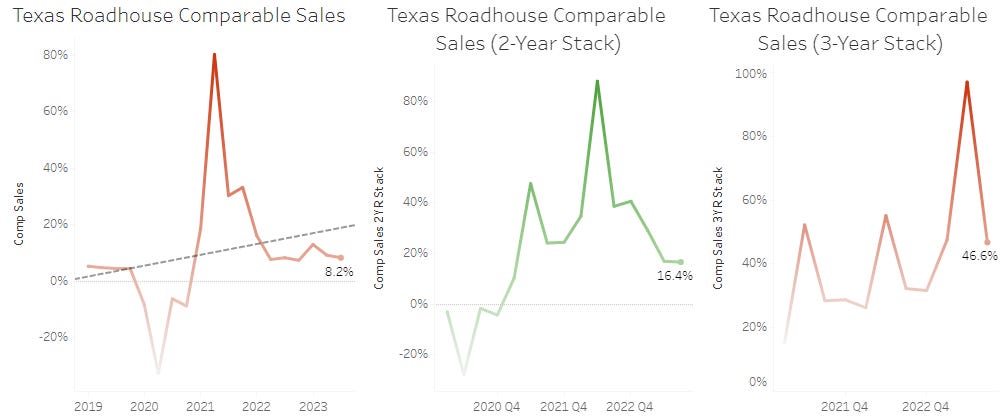
Texas’s TXRH 0.00%↑ comparable sales continue to be strong, coming in at 8% in the quarter, and 16% for the 2Yr Stack.

Margins continue to be the weak spot, with another result below the median, and off the high-teens target. Margin dollars still increased nicely year-on-year by about $10M. Management cites adjustments to its general liability insurance reserves and gift card breakage adjustments as reasons for the weaker margin percentage.
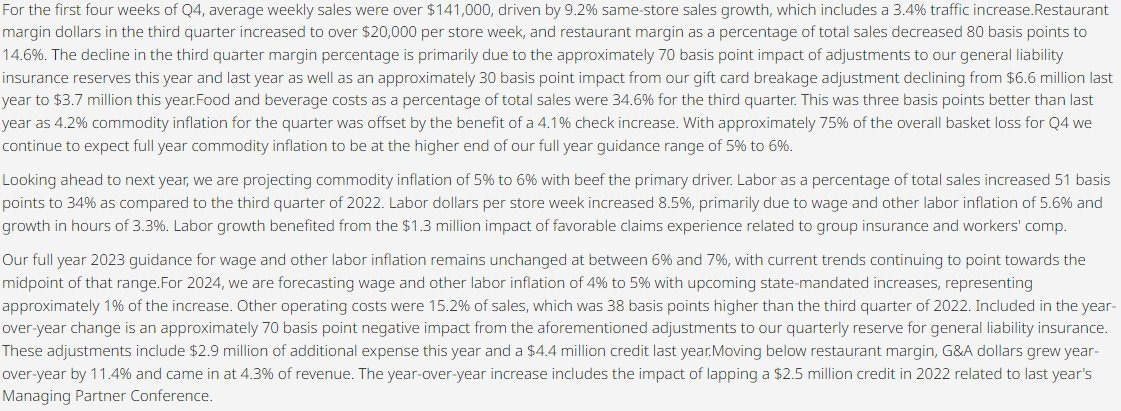
Management provided its outlook for next year, saying commodity inflation will be 5-6%, primarily driven by beef costs. They also see wage & labor inflation of 4-5% with 1% coming from state-mandated increases.
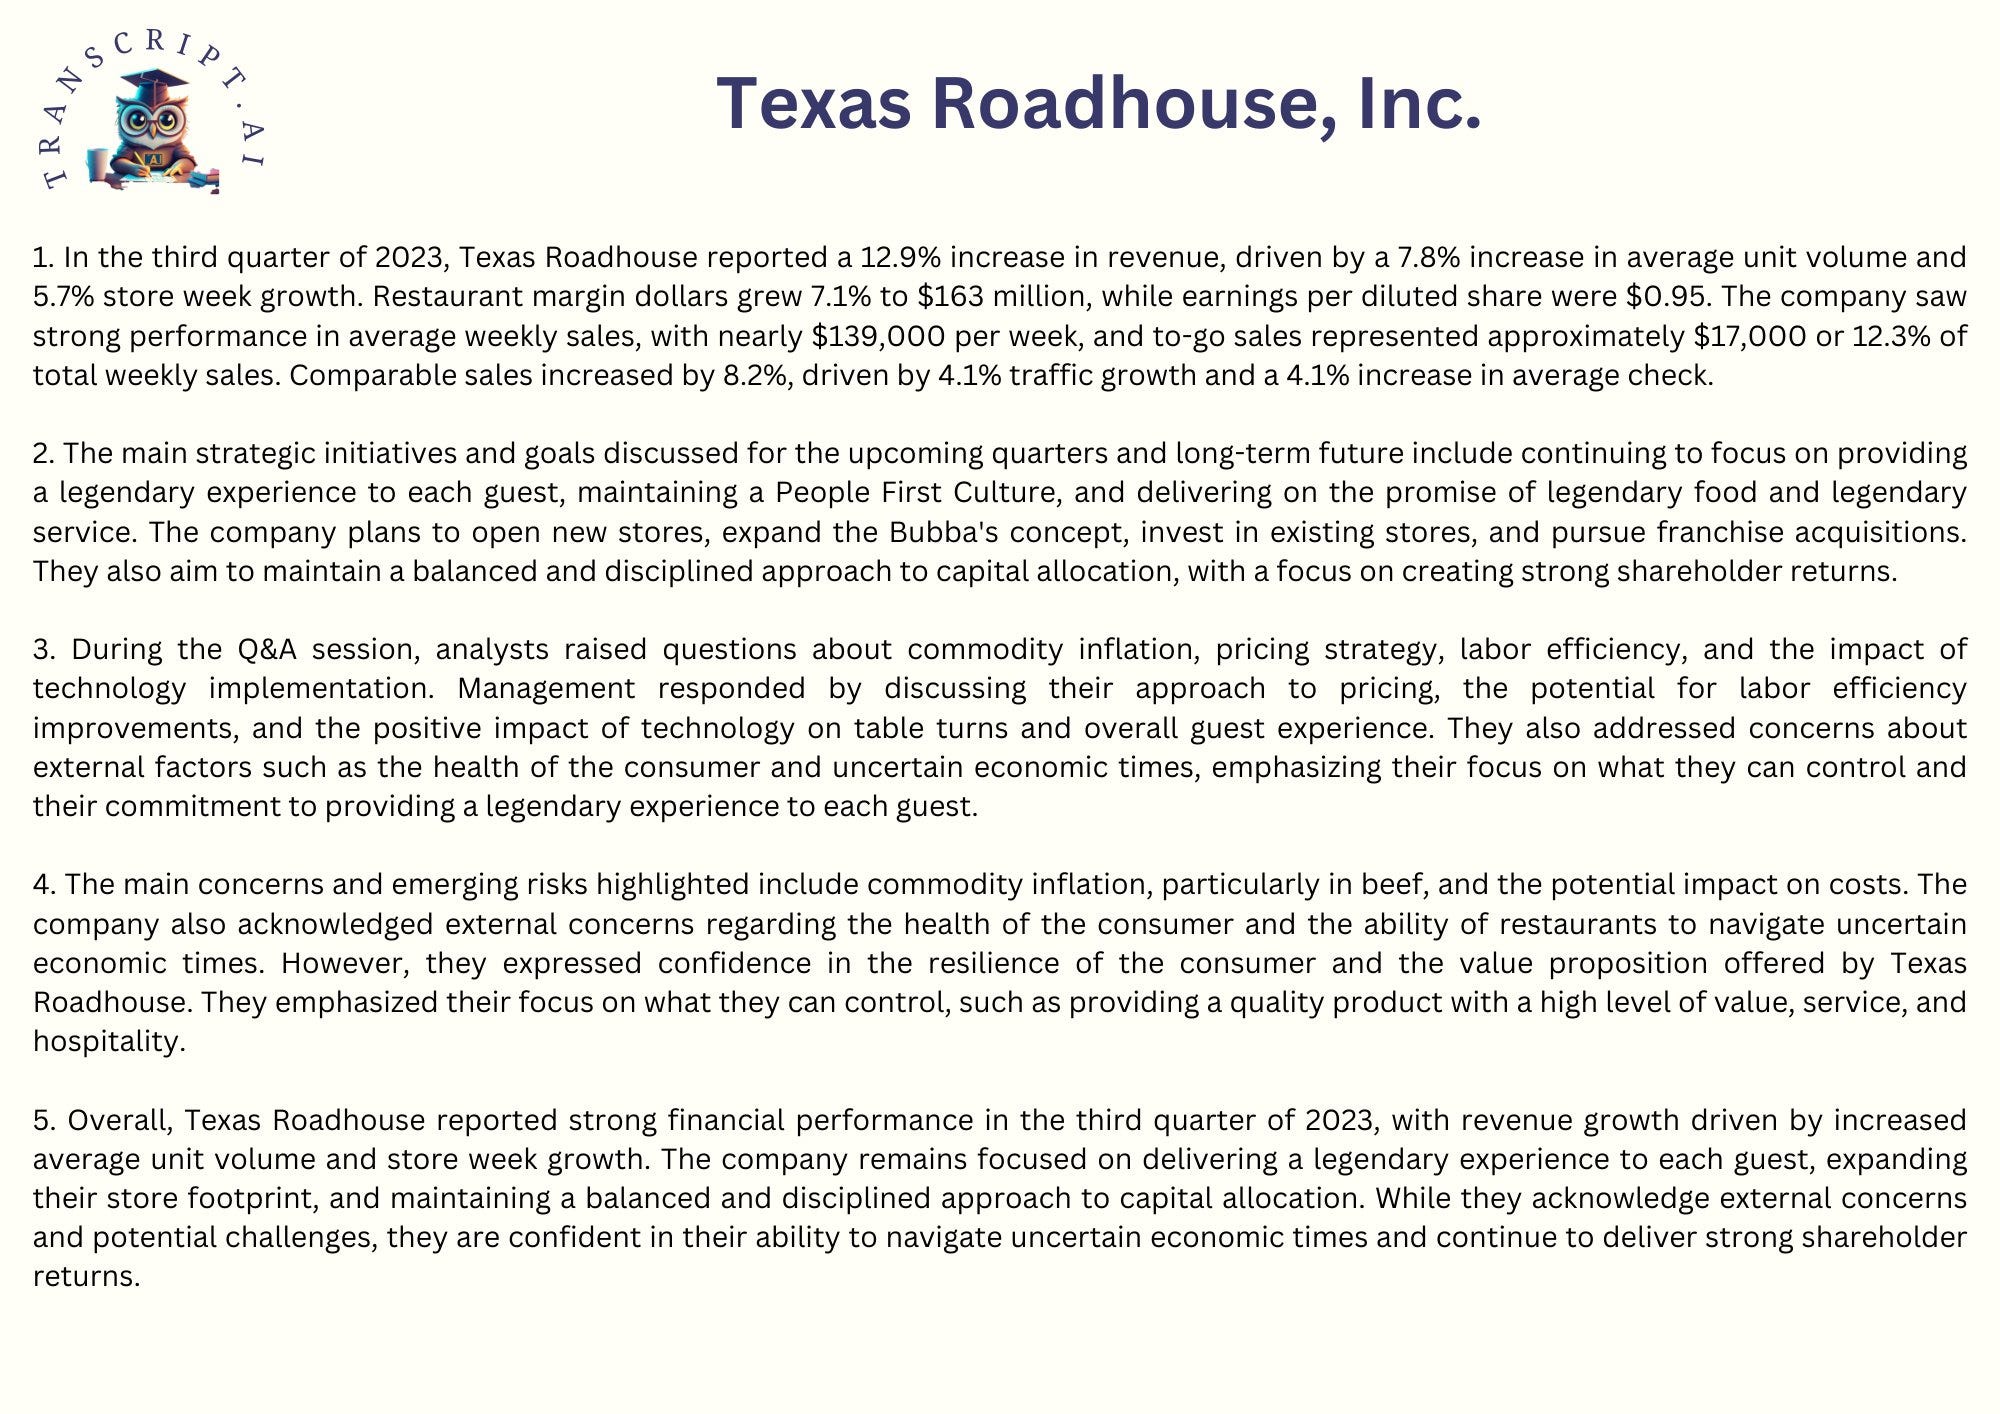
Here is a summary of the call from Transcript AI. Amazingly, there was no mention of weight-loss drugs despite 40 minutes of Q&A. Inflation continues to be the biggest worry, followed by the financial health of consumers. We had the boom of durable goods during the pandemic, then a rise in services came next, and now we wait to see what is next. Will consumers be pressured by rising costs or job loss, making it more difficult to go out to eat at Texas Roadhouse? That is possible. Will weight-loss drugs reduce the appetite of consumers, resulting in smaller bills at Texas Roadhouse? Also possible.
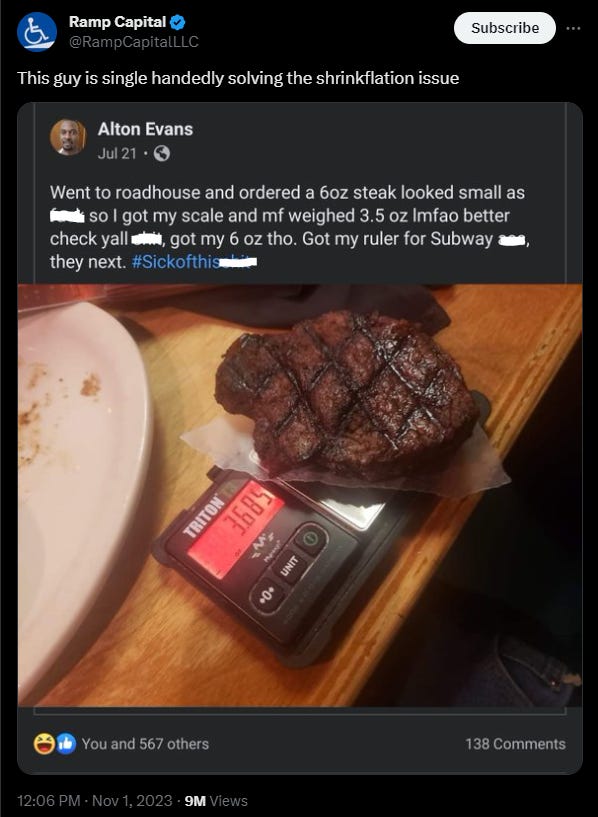
In addition, this meme was funny:
Monolithic Power (Dashboard)
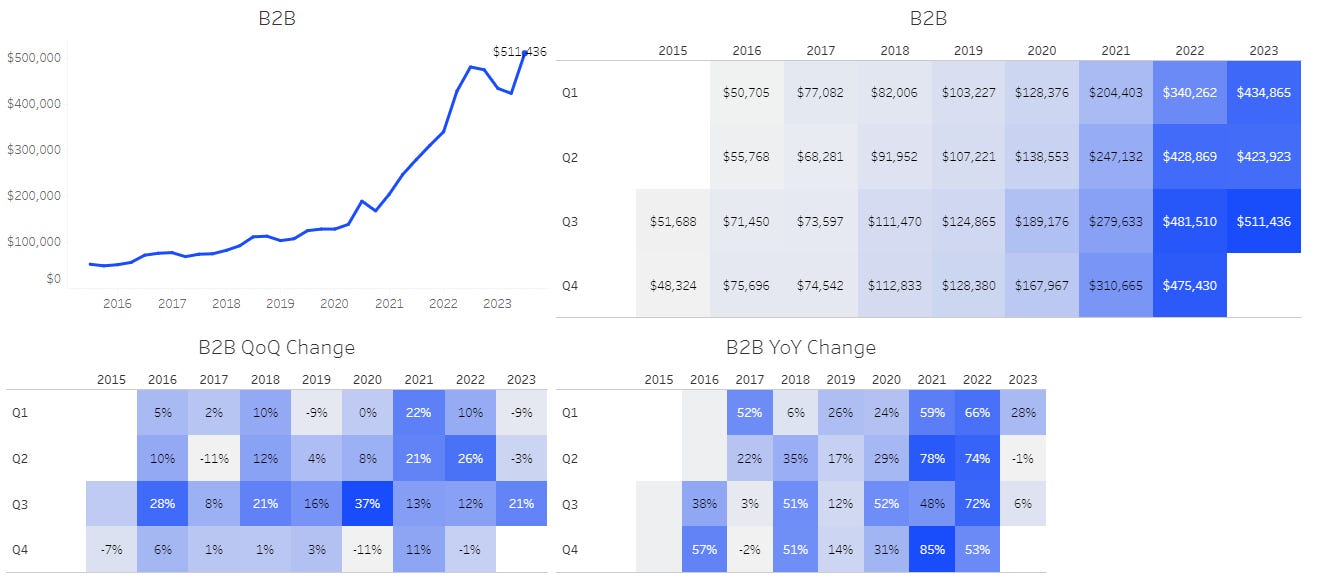
Overall, B2B sales were up 21% QoQ and 6% YoY (against a +72% comp). It is amazing how much MPS MPWR 0.00%↑ has grown in the last few years. B2B sales were around $100M just five years ago, and now in Q3, sales topped $500M.

When we look through the dashboard, it was mainly Enterprise Data that provided the boost for B2B sales, more than doubling sequentially. Automotive was down 9% QoQ and Industrial was down 15% QoQ and 28% YoY. Comms was down 35% YoY. The reliable B2B & Industrial sales that held up nicely during the semiconductor downturn is now pulling back. We are starting to see similar reports out of Texas Instruments, Analog Devices, and Microchip.

MPS’s balance sheet shows cash & short-term investments topping an impressive $1B now. Inventories, interestingly, are down about 11%.


Management announced a $640M share repurchase plan. Management says that the size of this repurchase, which is unusual for MPS, reflects its confidence in free cash flow over the next three years. MPS has a large stock-based compensation expense and is consistently diluting shareholders, as seen in the chart above.


Lastly, I find MPS to be one of the more interesting conference calls, and this one was no different. MPS always reports this “Lighting” segment but Michael and Bernie seemed to have no idea what it was when asked about it at the end of the call. I do not know whether to find this funny or worrisome knowing that there are short sellers going after MPS. Remember Spruce Point calling for MPWR stock to decline to $21-35 per share? Yikes! MPWR is up about 250% since that report.
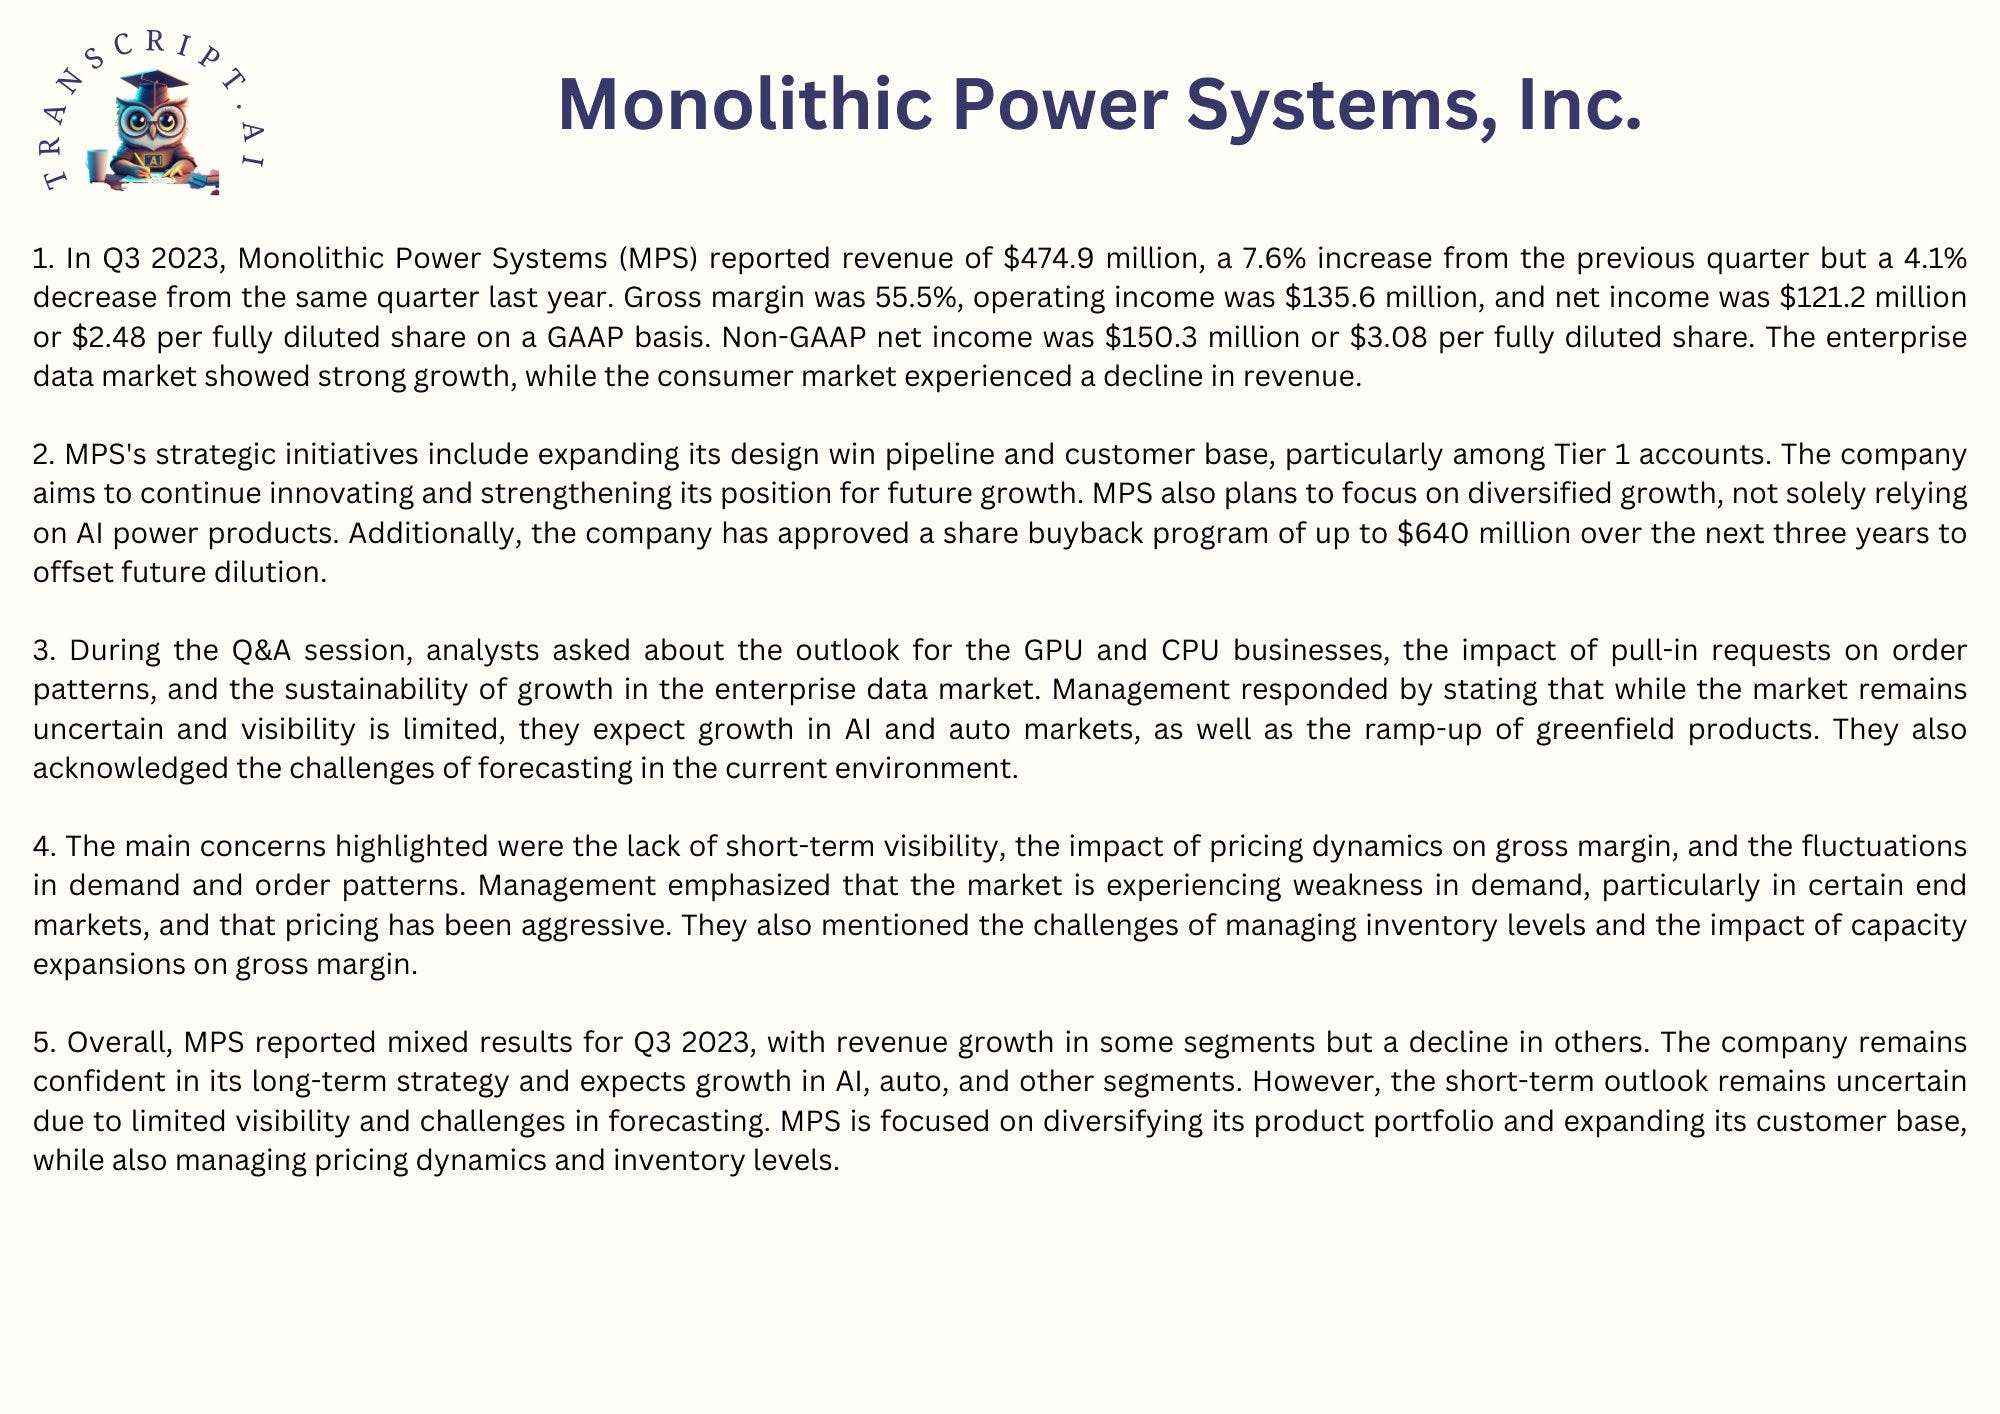
Here is the call summary from Transcript AI.

Exponent (Dashboard)

Exponent EXPO 0.00%↑ had a rare poor quarter. "This includes a decline of approximately $8 million in our consumer electronics business, which created a 6% to 7% headwind as compared to the third quarter of 2022."

The company does not specifically mention any names of large customers in its fillings or during this call. I’ve read that large consumer electronic companies, Facebook and Samsung, for example, are big customers for Exponent. I do not know for sure, but management has mentioned virtual reality and augmented reality to be drivers of growth in the past, so could this be Facebook maybe taking a step back on its headsets? I know Facebook got a lot of pushback on its Reality Labs spending in recent years. It could be that these headsets are getting less focus, resulting in lower spending on consulting services. Again, this is just a guess. Exponent’s CFO says the projects got pushed out to Q1 of next year, so this should hopefully not be the end of the world.

EXPO stock has not done much since being removed from the small-cap index and placed into mid-cap. Small-cap managers had to sell the stock, I assume, but the mid-cap managers had to buy it, so it just seemed to be trading in a range. The stock had a breakdown out of the range after this earnings report. Despite the 40% drawdown from peak, EXPO still trades at 35X (about 1.5X relative to the S&P 500) next-twelve-months earnings, which is close to the 20-year mean. This has been one of the most consistent stocks of any, so it is concerning to see it come down 40%. Long-duration stocks like this one just may not work as well with higher risk-free rates.
I received some feedback on Twitter/X about Exponent. One user says this is a good opportunity to buy for long-term holders and wanted to initiate a position in the $60s. Another user said that the market has been irrational on this name for far too long and permanent capital loss is on the way. This user said they were concerned about Exponent’s ability to control costs related to its consultants.
I increased my position in EXPO by 30%. My portfolio is always available to track on Commonstock.
That is all for earnings this quarter. I will be back to individual company posts next Friday. Thanks for reading and subscribing! Please share any thoughts below.
Disclosure:
I own AAPL, TXRH, and EXPO stock. I do not own MPWR. Please see my holdings disclosure located in the Google Sheets link.
Any views or opinions are my own. I do not represent a firm. I am not giving financial advice. The stocks that I write about could increase in value, lose value, or stay the same value. Investing involves risk and losses can occur. Some stocks I write about may not be appropriate for you and you should consult a professional investment advisor. Data presented is from sources I believe to be reliable. The opinions and commentary presented reflect my best judgement at this time and may include “forward-looking statements”, all of which are subject to change at any time without obligation to update them. Actual future results may be different than my expectations.
This post and the information presented are intended for informational purposes only. The views expressed herein are the author’s alone and do not constitute an offer to sell, or a recommendation to purchase, or a solicitation of an offer to buy, any security, nor a recommendation for any investment product or service. While certain information contained herein has been obtained from sources believed to be reliable, the author has not independently verified this information, and its accuracy and completeness cannot be guaranteed. Accordingly, no representation or warranty, express or implied, is made as to, and no reliance should be placed on, the fairness, accuracy, timeliness or completeness of this information. The author assumes no liability for this information and no obligation to update the information or analysis contained herein in the future.